|

The free newsletter of
Lean Manufacturing
Strategy
Lean Briefing Archives

Books & Videos
Strategos offers several books and eBooks written by our associates on lean topics. Click on "Products" at the main menu for more information.We also offer several useful banners and datasets for analyzing inventory.

The Strategos Guide To Value Stream and Process Mapping goes far beyond symbols and arrows. In over 163 pages it tells the reader not only how to do it but what to do with it.
More info...
Strategos Guide to Value Stream & Process Mapping
Also...
Guide to Cycle Counting
Warehouse Planning Guide
Human Side of Lean Video

 |
 |
Future State Value Stream Mapping, Step-By-Step
How To Do It; What To Do With It
|
Mapping the Future State
A Future State Value Stream Map helps with the larger process of developing your
Lean Manufacturing Strategy. It requires significant
knowledge of Core Disciplines and other specific topics.
Designing a Future State requires more art, engineering and strategy than Present State mapping. On this
page, we show mapping, but the background knowledge is in these other parts of our site.
|
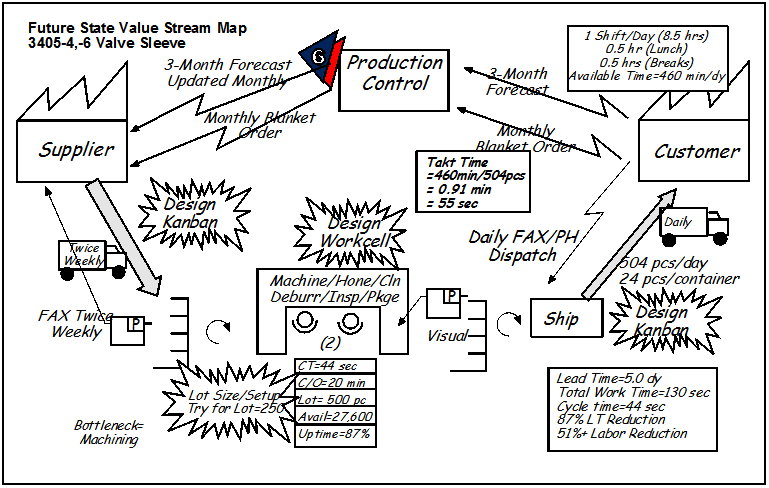
Here, we use the example from above. After constructing the
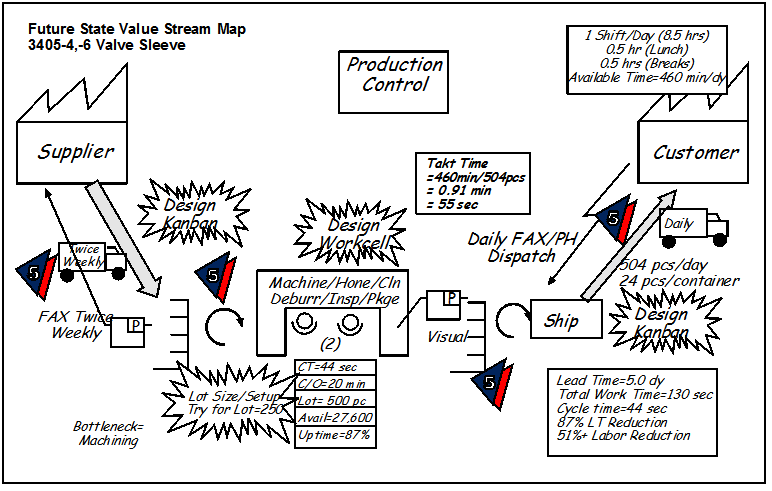
Present State Map, follow steps 1-7. The map below shows the final results. Note the large improvements in
Lead Time, productivity and inventory reduction.
You can expect much discussion about details of implementation and feasibility of various options. This
is normal. Our goal is to establish general feasibility, not to decide every detail of the design or to plan
an implementation. The facilitator must maintain careful control over this type of digression.
Click on each thumbnail for an enlarged view and explanation.

|
0. Review Present State Map
Step 0
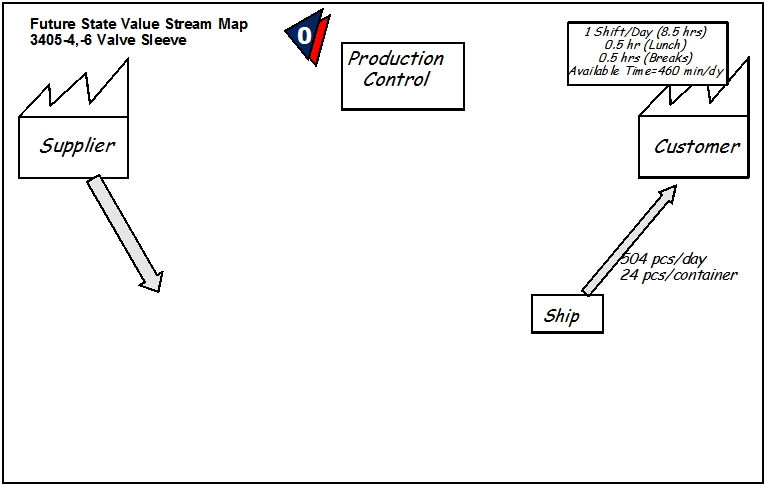
Review Present State Map and Transfer Information
Some information remains unchanged between the Present State map and possible Future State maps.
Transfer this information such as customer requirements, supplier and customer to the Future State map.
At this time, the VSM team should review their Present State Map.
This review should answer three questions:
-
Is the map essentially correct?
-
Does everyone on the team understand the map in all
its detail?
-
Where are the major opportunity areas?
The teams under the facilitator’s guidance can only answer
the first two questions. We have little advice here other than to question team members
closely and discuss these questions thoroughly. If there is disagreement within the team
on how to represent some items, you can simply note this disagreement. It is unnecessary
to resolve every detail.
Major opportunities may be available where the following
conditions exist:
|
1. Calculate Takt Time
Step 1
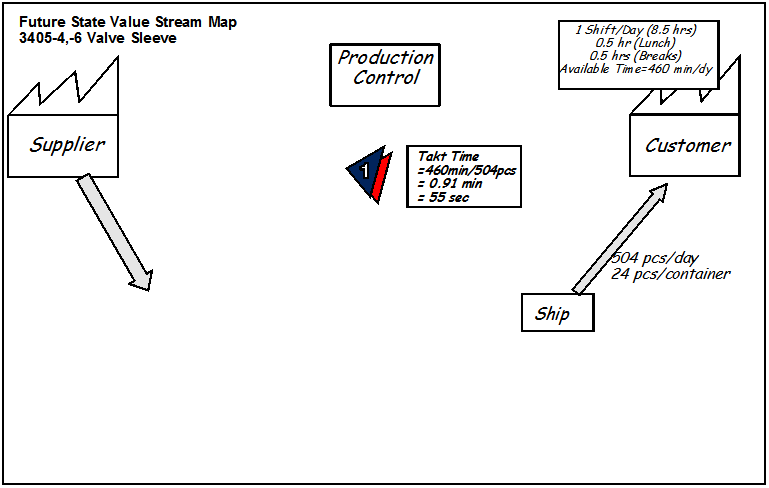
Calculate Takt Time
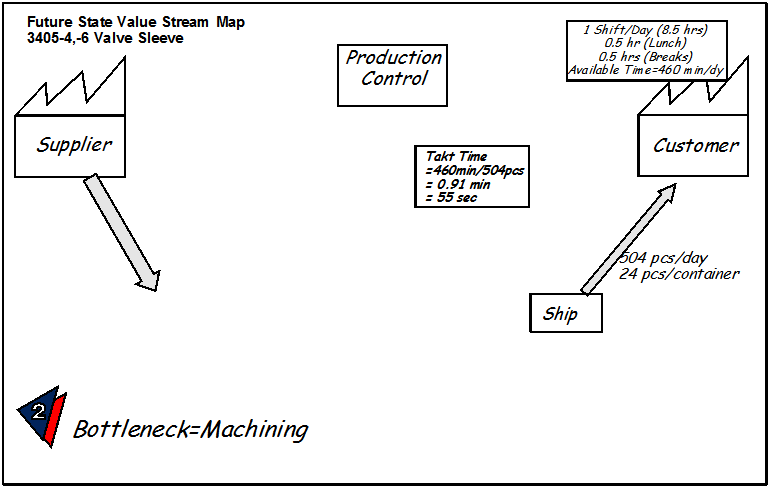
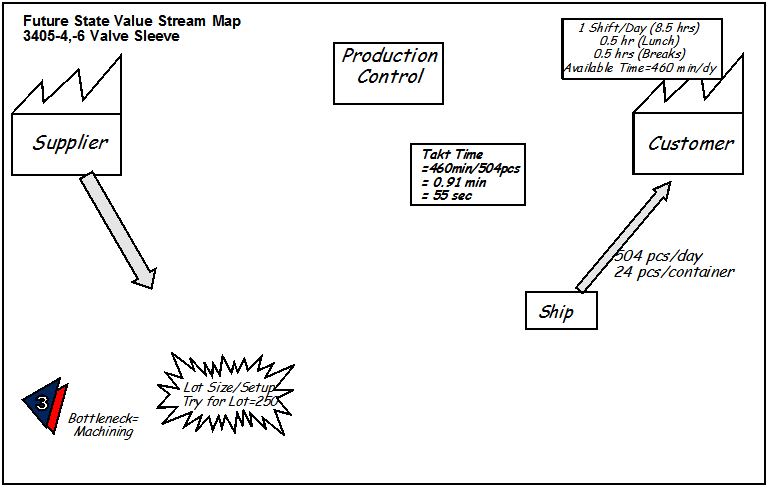
 Takt time
is the average time between production units necessary to meet customer demand. We use the available time
divided by the required number of units from the previous example. Takt time
is the average time between production units necessary to meet customer demand. We use the available time
divided by the required number of units from the previous example.
|
2. Identify Bottleneck Process
Step 2
Identify Bottleneck Process
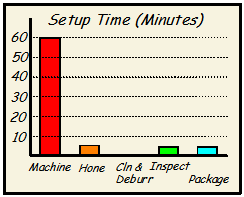
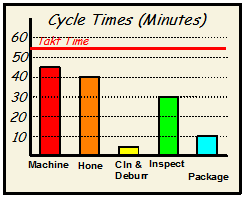 The bottleneck process is the operation with the longest cycle time. In the example, this is machining at 44 seconds. The bottleneck is important because it:
Determines total system output.
Becomes the primary scheduling point
A work balance chart (above) is helpful for steps 2 and 3. Cycle time is plotted on the vertical axis for each operation. The bottleneck process is the operation with the longest cycle time. In the example, this is machining at 44 seconds. The bottleneck is important because it:
Determines total system output.
Becomes the primary scheduling point
A work balance chart (above) is helpful for steps 2 and 3. Cycle time is plotted on the vertical axis for each operation.
|
3. Lot Sizing & Setup Opportunities
Step 3
Identify Lot Sizing/Setup Opportunities
 Present lot size is 1000 pieces, about two day's production. This requires at least 3-6 days finished
goods and prevents daily adjustments to mix or demand. Present lot size is 1000 pieces, about two day's production. This requires at least 3-6 days finished
goods and prevents daily adjustments to mix or demand.
If the lot size were simply cut, it would allow faster response but additional setup time in machining
would use available time. Machining could not meet the average customer requirements.
However, if a focused setup reduction is made on
machining and setup becomes 20-30 minutes, a batch size of
500, or even 250 is feasible. The mapping team established this as a goal, noted by a
Kaizen Burst.
|
4. Identify Potential Workcells
Step 4
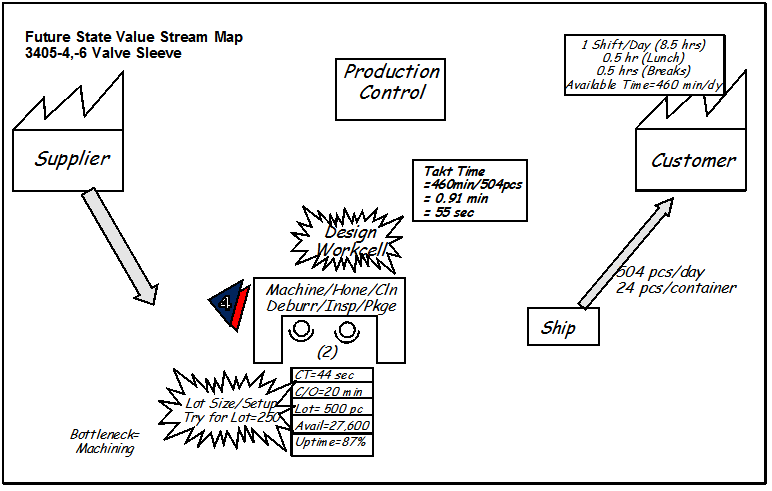
Identify Potential Workcells
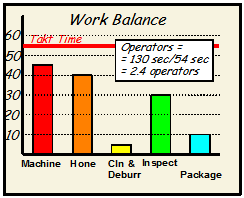 The balance chart shows cycle time for each of the five process steps.
Machining and honing operations are closely balanced. Cycle times for clean/deburr, inspection and packaging are quite short in comparison. The balance chart shows cycle time for each of the five process steps.
Machining and honing operations are closely balanced. Cycle times for clean/deburr, inspection and packaging are quite short in comparison.
The very short cycle times for clean/deburr and packaging indicate low utilization in a cell. However, inspection and packaging are manual operations that require little more than a workbench and hand tools.
High equipment utilization is not critical.
Clean/deburr process is run on specialized equipment in a central area.
If clean/deburr can be scaled down as a manual or semi-manual operation, it can go in the cell. This seems feasible and the team accepts that,
somehow, it will be done.
It appears that three operators can run the cell. This is not a precise calculation. It only considers present cycle
times and ignores setup.
Workcells are more involved than suggested here. However, our purpose is not to finalize details but
make reasonable guesses about the general configuration. A Kaizen Burst identifies a need for more work.
|
5. Determine Kanban Locations
Step 5
Determine Kanban Locations
With a workcell for five processes, scheduling between them becomes a trivial case. They will be directly
linked with continuous or small-batch flow. Kanban, internal to the cell, is unnecessary or becomes part of the detailed cell design.
Kanban does apply at two other locations:
The detailed design of the kanban system is shown as a Kaizen burst. Inventory levels are current best estimates.
|
6. Establish Scheduling Methods
Step 6
Establish Scheduling Methods
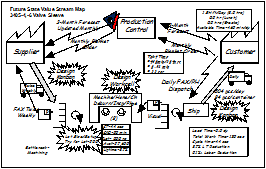
Kanban and direct links now schedule all operations short term. Both the workcell and the supplier, however,
need forecasts to plan staffing and possible changes in inventory levels. The map shows this monthly information flow.
Purchasing must arrange for payment. They intend to do so with monthly blanket orders, also shown.
|
7. Calculate Lead and Cycle Times

Step 7
Calculate Lead and Cycle Time.
The final step in the Future State Map is to complete the timeline at bottom, and calculate Lead Time, Cycle Time and Work Time.
Results
In this example, the mapping team estimates a Lead Time reduction of 85% and a productivity increase of 25%.
Inventory will decrease about 85%. Many additional, but unpredictable benefits are also likely.
|
|
|
|


