Production Linearity
Production linearity refers to the steadiness and repetitiveness of daily production output.
As Henry Ford understood, efficiency and quality come from producing the same products, at the
same rate, in the same way every day.
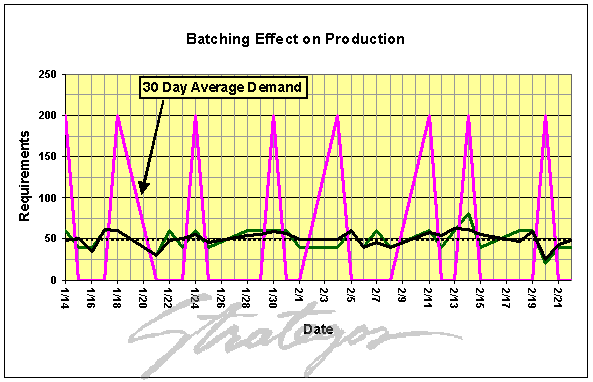
This chart shows the effect of large and small lots on one particular workcenter's
production of a particular item.
A green line shows daily demand from the customer. It averages 50 units/day and does not vary
more than about 20%. The black line shows the actual production if units are made in lots of 20
or about 0.4 days of demand. With this small lot size, required production tracks demand and
even smoothes the demand a bit. Output is quite linear.
A lot size of 200 units is about 4.0 days of demand. The purple line shows production
requirements. Here there are large, intermittent swings between 200 units and 0 units-- very
non-linear.
This kind of pattern complicates scheduling, precludes the use of kanban and generates large
inventories. The slightest glitch can cause stockouts.
|

|
Inventory
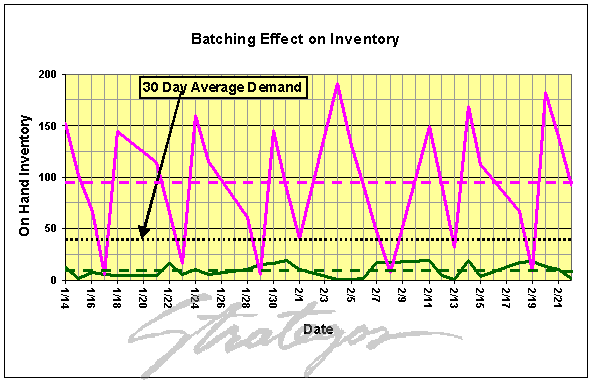
Batching has an even greater effect on inventory. This chart shows the theoretical minimum inventory on
hand downstream of the workcenter. A lot size of 20 units generates an average inventory of 15
units.
A lot size of 200 generates an average inventory of 93 units with wide fluctuations. This is
a 600% increase!
Actual inventory would be much larger than shown here because of the uncertainty of
fluctuations, the difficulty of correcting a stockout and the need for coping with other
contingencies.
the next page reviews the old Economic Lot Sizing (ELS) approach, its
shortcomings and how to use it sensibly. Further pages bring in considerations from
Theory of Constraints and show how to make rational and practical decisions. The final page in
this series illustrates the effects of Setup Reduction and why it is so important.

|

|


