Experience Curve Characteristics
Typical Experience Curve Slopes
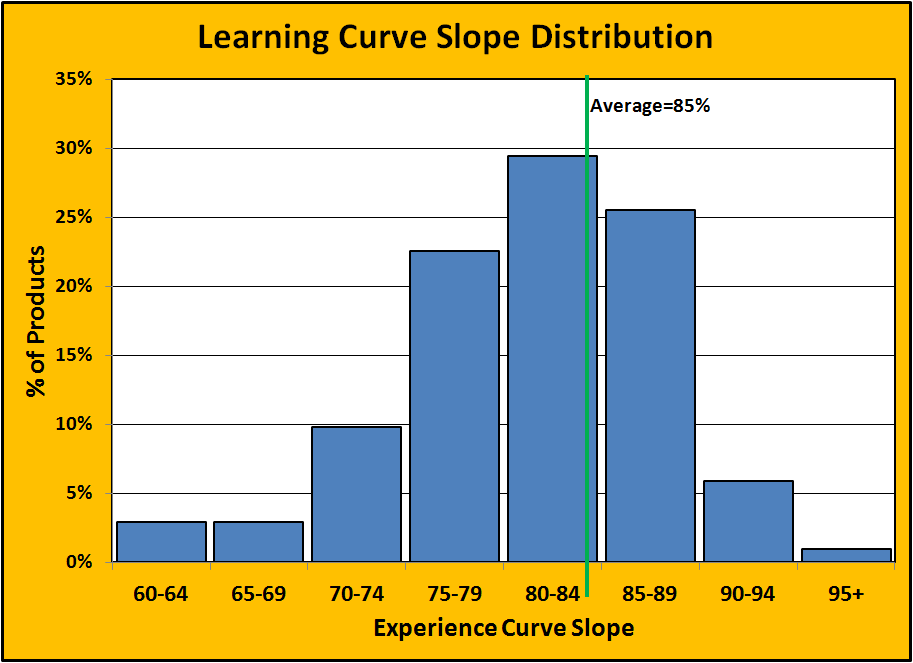
The slopes of Experience Curves tend to range from 60% to 90% with an average of about 85%. This is the conclusion of GHEMAWAT from a compilation of 97
academic studies. It is also the range generally seen in the literature. Learning slopes also vary by industry and process type. The
distribution of Ghemawat's study is in figure 5.
Competitive Effects of Improved Learning
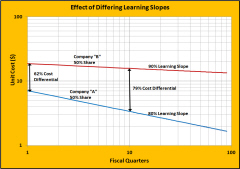
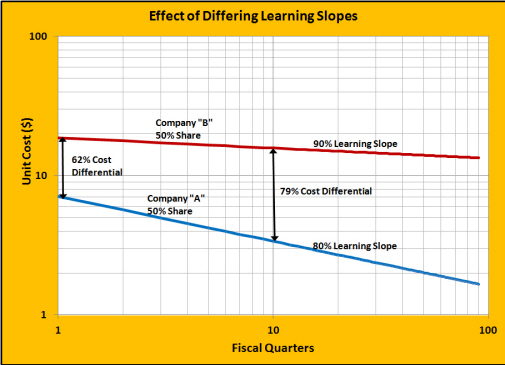
Two firms, "A" and "B", have constant sales and constant market share but different learning rates. Figure 6 shows their cost performance over time.
Note that the horizontal scale is in time units (quarters), not cumulative production.
Company "A" has a steeper slope where costs at each doubling are 80% of the previous costs. In nine fiscal quarter, Company A's cost advantage has
gone from 62% to 79% over Company "B". This is true even though both companies have the same market share and the same production volume.
Company A's management has developed a culture of improvement and/or investment policies superior to Company B.
Market Share Effects
Much has been made about the effects of market share and the idea of building a long-term strategy on increased market share, increased learning
and lower pricing. Our exploration of several models suggest that the slope of the learning curve is far more important than market share.
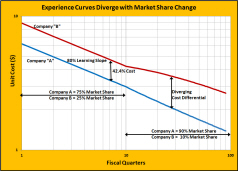
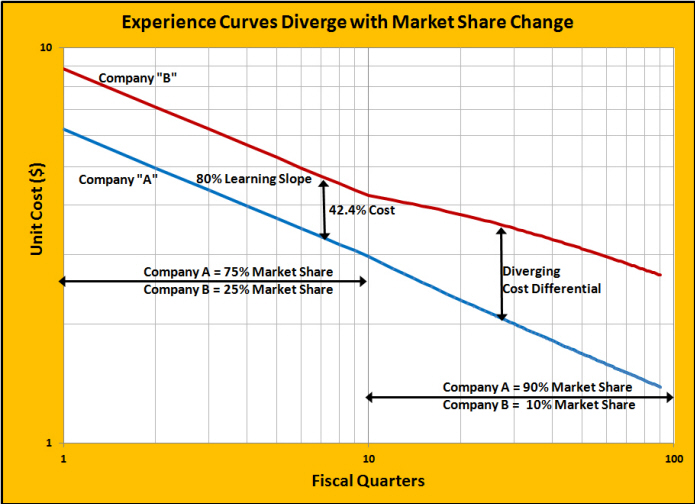
Figure 7 illustrates. Here, two firms, "A" and "B" have the same learning slope but firm A has three times the production and market share as
firm B. With no change in market share for the next 10 quarters, the relative cost advantage remains constant even though cost for both firms is
declining. After the tenth quarter, firm A increases market share, presumably by using its cost advantage to lower prices. At this point, the cost
advantage of firm A widens but quickly stabilizes at a new point. Our model suggests that a difference in learning slope would have much greater
effect than market share changes over any reasonable timespan.
|