Key Features
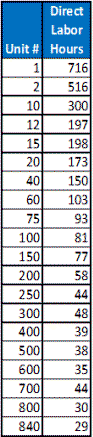
The example above is typical
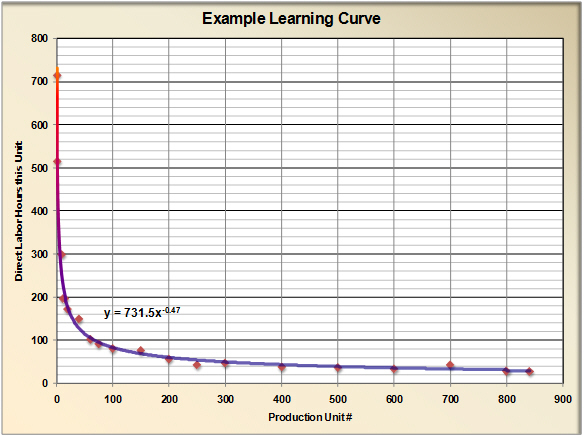
of many situations. Direct labor hours for each unit of production drops rapidly during production startup. The improvement
from one unit to the next becomes smaller and smaller but it does continue, often for decades. When plotted on a log-log scale, the data approximates a
straight line as shown above right. The slope of this line indicates the intensity of "learning" or improvement. Hence the phrase "steep learning curve"
indicates a situation where improvement is coming quickly.
The concept and general form of the function applies to a
wide range of industries
. It also applies on a wide range of scales from
the individual worker performing a specific task to national economies such as China. It works for:
-
Individuals
-
Workcells & Work Teams
-
Factories
|
-
Firms
-
Industries
-
National Economies
|
| Representative Learning Rates |
| Aerospace |
15% |
| Shipbuilding |
15%-20% |
| Machine Tools (New Models) |
15%-25% |
| Electronics (Repetitive) |
5%-10% |
| Electrical Wiring (Repetitive) |
15%-25% |
| Machining |
5%-10% |
| Manual Assembly+25% Machining |
20% |
| Manual Assembly+50% Machining |
15% |
| Manual Assembly+75% Machining |
10% |
| Punch Press |
5%-10% |
| Raw Materials |
5%-7% |
| Purchased Parts |
12%-15% |
| Welding (Repetitive) |
10% |
Most examples in the literature illustrate learning curve effects on direct labor. However,
many other dimensions
of manufacturing performance follow the
same pattern. Examples are quality, delivery and (over the long term) total cost.
The table shows representative learning rates
compiled from various sources in the literature. The percentages are the improvement that comes with each
doubling of cumulative production. There will be considerable variation from one organization to another within these large categories.
Learning Is Not Pre-Ordained
Performance gains from the learning curve effect are common but not universal.
There is no physical law that requires individuals, work groups, companies
or industries to learn from their experience.
Performance gains come from a variety of mechanisms discussed below but behind these mechanisms is a
willingness to learn, an ability to learn and, in many cases, an investment in learning.
Individuals, work groups, companies and industries that do not have the
willingness, ability or investment
may find their costs declining very little or,
even increasing. The most common cause of slow learning is the willingness component that results from corporate or industry arrogance. The Detroit
automakers in the 1960's and 1970's possessed a great deal of arrogance that prevented them from learning from the Japanese or even their own experience. It
was not until declining market share and bankruptcies forced a bit of humility that these companies began their comeback.
|
What Determines The Slope
Many factors can determine the learning curve slope for a given individual, team, factory or industry. Among these are:
-
Management Styles & Actions
-
Corporate Culture
-
Organization Structure
|
-
Technology
-
Capital Investment
-
Engineering
|
Sources of Cost Improvement
Product Design—As products mature they often go through redesigns. One purpose of this redesign should be making
the design easier and less expensive to manufacture. Designers can become more familiar with Design for Manufacturability. Improved coordination and
communication between manufacturing and the designers also helps.
Direct Labor Efficiency—improvements in the arrangement of the workplace, improved balancing of work, motivation and
improved equipment are among the contributors to direct labor learning.
Indirect Labor Efficiency—
material handling, coordination, scheduling, maintenance and other support activities often consume more
labor than actual production. Improvements here are just as important as direct labor but are often harder to quantify.
Economies of Scale—large scale equipment may lower costs in several ways. For example one machine with twice the
capacity may cost less than two machines with only half the capacity. A small paper machine may require the same size crew as a larger machine but produce
far less paper. Sometimes, however, there are dis-economies of scale. Larger factories, for example, often are less efficient than smaller
focused factories.
Plant Layout—An effective plant layout simplifies workflow reduces handling cost and improves coordination. It often reduces
inventory as well. Such a layout often implements Cellular Manufacturing and is a first
step in Lean Manufacturing initiatives.
Process Improvement—takes many forms at many levels. The small but numerous improvements that result from
5S can be as effective, cumulatively, as a piece of major new equipment. Process improvements can also be simply a change in
sequence of operations or the elimination of unnecessary steps.
Pages...1 - 2 -
3 - 4
|