Why Draw Pictures?
A factory is enormously complex. Only visuals convey enough information to understand the
pieces, relationships, hidden waste and time-domain behavior.
Visualization brings a deep understanding and major breakthroughs in productivity and other
performance. It leads to consensus on systemic problems and remedies. While finished charts
communicate information about a situation, the real value is the mapping itself. This is where
insights grow, paradigms shift and consensus builds.
Value Stream and
Process Maps take different perspectives,
but, the work they visualize is the same. Both have a place
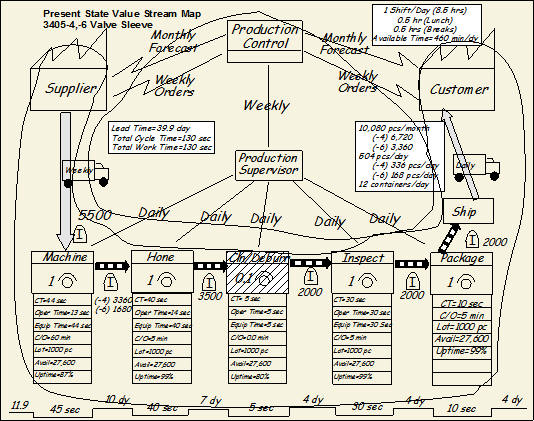
Value Stream Maps
These show major process steps and often take a broader and wider view. They may group a wide
variety of products into a single "value stream." Here is an example:
|
 The
Strategos Guide To The
Strategos Guide To
Value Stream &
Process Mapping
Quarterman Lee's latest book on
Value Stream Mapping and Process Mapping goes far beyond symbols and arrows. It tells
the reader not only how to do it
but what to do with it. More
Info >>
|
|
Process Maps (charts)
These are also known as "Process Charts" or "flow Process Charts". They trace the sequence of
events for a single product. While they can be done at any level, the most useful charts are
quite detailed. This is important because most waste is at a micro- level.
Frank Gilbreth's symbology, which we
prefer, is simple and visual. One does not need the Rosetta Stone to decipher hieroglyphics. It
dramatically displays waste. In this example, all but the green circles are waste.
Process mapping is a great tool for Kaizen events.
Their simplicity makes them ideal when training time is limited.
Which To Use?
The short answer is both:
|