|

The free newsletter of Lean Manufacturing Strategy
Lean Briefing Archives

Books & Videos

The Strategos Guide To Value Stream and Process Mapping goes far beyond symbols and arrows. In over 163 pages it tells the reader not only how to do it but what to do with it.
More info...
Strategos Guide to Value Stream & Process Mapping
Also...
Guide to Cycle Counting
Facilities & Workplace Design
Warehouse Planning Guide
Human Side of Lean Video


|
 |
Modeling The Capacity-Inventory Relationship
Deep Learning From Simple Models
|
How Variability Affects Inventory
|
Variability is the reason that inventory rapidly rises
with increasing utilization. The amount of variability shapes the
curve that defines this
relationship. The amount of variability also limits capacity. With high variability, a factory
or production line "chokes up" well below theoretical capacity.
|
The figure below shows how this works. It was
developed by simulating a simple production line
with perfectly balanced (on average) stations. However, each station's work time may change from
cycle to cycle, e.g., variability. The results apply, qualitatively, to most work processes.
|
|
The yellow curve shows how inventory varies when all stations are
balanced and work times have no variation. At low utilization, workpieces enter the line at well
below the maximum production rate and quickly move from station to station. With ten stations
and 10% utilization only one workpiece is in the system. It exits before the next is released.
Above 10% (in this case) several workpieces are in the system but each is at a workstation.
Above 100% capacity, all stations are full and inventory builds at the line's first station.
This is how most production systems are presumed to operate, but they rarely do so because of
variability.
|
With variable work times, shown by the other curves, stations are unsynchronized and
inventory collects between them. This inventory buildup begins to accelerate well below 100%
utilization. Eventually, the system cannot process work as fast as the inventory builds and
output remains constant, even with rising input.
In this particular
model, the system choked at about 75% capacity when the coefficient of variation reached
1.0. This explains why many production systems never seem to achieve their potential.
|
Modeling the System
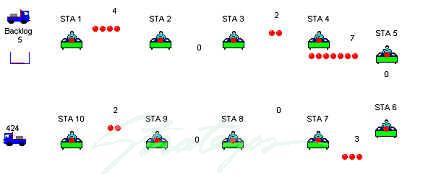
Simul8 Model of Simple WIP Inventory System
In this model products flow from one workstation to the next
with queues between stations. The average work time for all stations is identical.
However, the work time for each item at each station varies.
|
|
Simple models often provide deeper insight than complex, "more
accurate" models. This paradox is one lesson from the relatively new science of Chaos and from
system dynamics. Great teachers from Goldratt to the Buddha used simple examples and parables to
convey profound principles.
To study capacity-inventory-variability relationships
in production systems, the simple model illustrated above, was constructed using Simul8
software. These are the important features:
-
They system is a simple, straight-through production
line with 10 sequential stations.
-
Each workstation has an average cycle time of 1.0
minute. Hence, the line is perfectly balanced (on average).
-
The capacity of this system, based on this average
cycle time, is 60 units per hour. This is a production rate corresponding to 100%
utilization.
|
-
Workpieces enter the system at regular intervals
corresponding to particular production rates from 0% to 100%.
Workpieces may queue at the head of the line
(labeled "Backlog"), if station #1 is not empty.
-
Workpieces may queue between stations if the
downstream station cannot accept a workpiece when the upstream station releases it.
-
The investigator introduces variation by increasing
or decreasing the standard deviation of the work times for all stations.
-
The independent variable is output rate. The
dependent variable is average inventory in the system.
The system was operated with six different values for
the work time standard deviation and through a range of workpiece input rates. When inventory
stabilized, the results were recorded.

|
|
|