|

The free newsletter of Lean Manufacturing Strategy
Lean Briefing Archives

Books & Videos

The Strategos Guide To Value Stream and Process Mapping goes far beyond symbols and arrows. In over 163 pages it tells the reader not only how to do it but what to do with it.
More info...
Strategos Guide to Value Stream & Process Mapping
Also...
Guide to Cycle Counting
Facilities & Workplace Design
Warehouse Planning Guide
Human Side of Lean Video


|
 |
Reliability
The Science of Maintenance
|
|
Beginning in World War II, the War Department
sponsored a new science called Reliability. Reliability is the science of maintenance. It uses
statistics and failure theory to measure, understand and improve the performance of equipment
and maintenance. Reliability theory can guide engineers as they design and test new equipment.
After equipment has been in service, reliability data tells the maintenance engineer how to
improve its performance.
As the Gulf Wars demonstrated, this science has
produced outstanding results in defense. Regrettably, little of this knowledge has found its way
into industry. Most maintenance operations still operate on the principal of "if it ain't broke,
don't fix it".
Failure Modes
Failures occur in one of several modes. Understanding
modes and what mode is the likely cause for specific failures is important because different
approaches or strategies may be more or less effective on the various modes. Table 1 summarizes
the various failure modes and illustrates their characteristic failure rates over time.
Reliability Metrics
Reliability uses many metrics for evaluating equipment
and systems. The original metric, Mission Reliability, answered the question of figure 4. For
industrial maintenance, the metric of Failure Rate is usually more relevant. Failure rate is the
number of failures per 1000 hours of operation. It can apply to a complex system such as a
machine tool or it can apply to a large number of simple components such as light bulbs. This
discussion focuses on units of complex equipment.
|
|

Figure 4 Mission Reliability
Question: If we dispatch 1000 heavy bombers for
an 8-hour mission, what percentage will complete the mission without mechanical failure?
|
|
Table 1
Failure Modes & Characteristics
|
Failure Mode |
Failure Rate Curve |
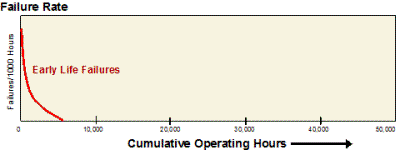
Early Life
These occur when the
equipment is placed in service and are caused by sub-standard components and/or improper
installation. Early life failures occur frequently when the equipment is first placed in service
and then rapidly decline.
|
|
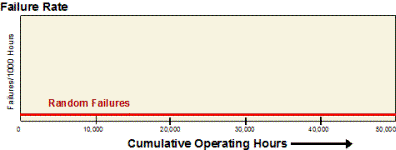
Random Failures
These result from variations
in both the load imposed on any given component and the variations in strengths of supposedly
identical components. Random failure rates are essentially constant over the life span of the
equipment and are normally small being overshadowed in most practical cases by other failure
modes.
|
|
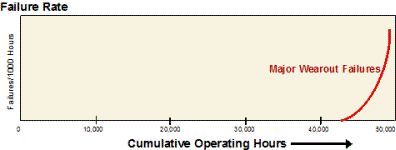
Major Wearout
This occurs when major
sub-systems or structures become worn or weakened to the point that proper repair is impossible
or impractical. Failure rate begins to rise sharply and the only solution is major overhaul or
replacement.
|
|
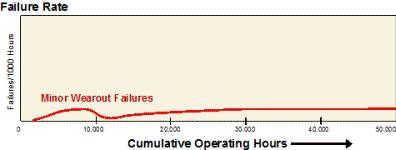
Minor Wearout
Most complex equipment
requires regular replacement of various components as each component reaches its individual
wearout life. Since the many components have different lives and are changed at different times,
the failure rate tends to be relatively constant overall and mimics the random failure rate
curve.
|
|
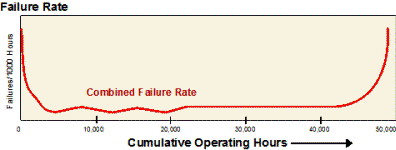
Early Life, Random & Wearout
When the previous failure
modes are combined, the result is the "Bathtub Curve", familiar to many.
|
|
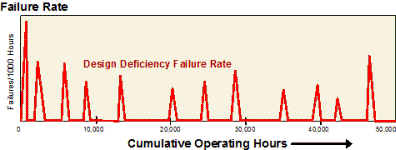
Design Deficiency
This type of failure is
the result of design error and shows up as a series of wearout failures. This type of failure
does not occur on equipment that has been extensively tested and developed. It is inevitable on
new designs which have not been thoroughly tested and on the "special" machines which are often
used in industry.
The worst problems will
normally be corrected early on until the failure rate is reduced to a tolerable level. At that
point, remaining design deficiencies are indistinguishable from minor wearout failure.
|
|
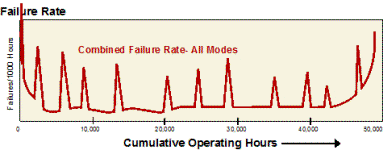
All Modes Combined
With all modes combined,
the failure curve is the familiar bathtub but with spikes of increased failures at irregular
time. Determining the mode for specific failures requires additional investigation and cannot be
determined from the failure curve alone.
|
|
Reliability Metrics
Measuring Equipment Performance
Metrics help to focus efforts on
the most critical equipment rather than reacting to the crisis de jour. They measure
progress and help to adjust efforts accordingly. They are critical for identifying and
resolving specific problems. Equipment metrics can be surprisingly simple. Only three data
elements, collected for each machine and analyzed properly, are really necessary for most
situations.
This discussion is about the
metrics for machine performance. It does not include metrics of maintenance department
productivity, budgeting or cost allocation. Such additional metrics are required to operate
a maintenance department effectively.
All these metrics are most effective
in graphical form. They are not very meaningful as individual numbers. However, in the
context of past and future, trends, anomalies and patterns reveal themselves.
All of the first four metrics, the most
useful, derive from three numbers. Assuming a calculation period of one week, the following
questions must be answered:
- How many breakdowns (failures) did we have
this week?
- How long did each breakdown take to repair?
- How many hours were scheduled for the equipment?
Calculations and tracking can be further
simplified by assuming that each machine is scheduled for about the same production (say 40
or 80 hours) and simply using one week as the time bucket.
|
|

|


