|

|
 In
A Nutshell In
A Nutshell
Explains how
batching in assembly or downstream operations causes erratic demand and scheduling
problems in fabrication and upstream operations. .
|
Assume a
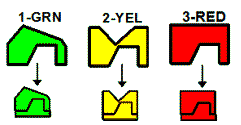
scenario where an assembly line builds three major variations of a similar end-product. Assume
also that the upper component comes from three separate sources (vendors or workcenters). The
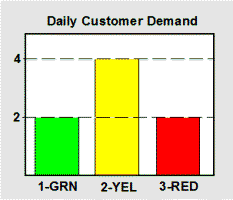
average demand for the green and red products is steady at two per day each. Demand for the
yellow product is four per day and is also steady.
 On large
assembly lines, setup is often problematic. Parts are brought in for a new job and
remaining parts taken away for the just-completed job. Such lines often need re-balancing with
different stations and task assignments. Then, there is the initial startup as everyone gets
accustomed to the new configuration. If parts do not fit, or cannot be found, there is more
disturbance. When, at last, the line is humming, nobody wants to disturb it with another
changeover. Such is the case with our hypothetical assembly line. On large
assembly lines, setup is often problematic. Parts are brought in for a new job and
remaining parts taken away for the just-completed job. Such lines often need re-balancing with
different stations and task assignments. Then, there is the initial startup as everyone gets
accustomed to the new configuration. If parts do not fit, or cannot be found, there is more
disturbance. When, at last, the line is humming, nobody wants to disturb it with another
changeover. Such is the case with our hypothetical assembly line.
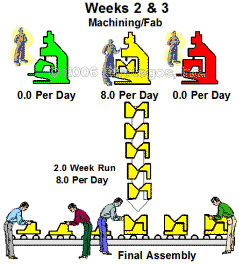
And so, once setup, the line runs for a week on the first product, 1-GRN. At the end of a
week, 40 units are complete even though the customers only need 10 units. The remaining 30 units
must go into inventory to carry the customer demand for the next three weeks. The figures below
illustrate.
After another frenetic changeover to product 2-YEL, the line runs for 2.0 weeks since the
demand for this part is higher. Eighty units are built. Twenty of these units supply customer
demand during the run. The remaining 60 go into inventory.
Another changeover and, for a week, the line runs 3-RED.
Forty units are made. Ten for customers and the remaining 30 for inventory.
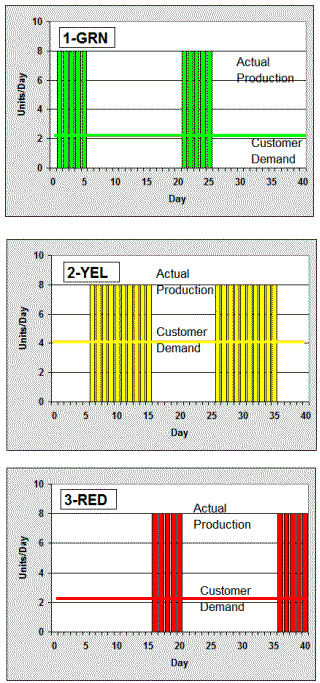
The three suppliers for the upper covers of, respectively, 1-GRN, 2-YEL and 3-RED, see high
demand for one or two weeks and then no demand for 2-3 weeks. The charts show this erratic
demand.
One way to deal with this
intermittent upstream demand is to size upstream production for the overall average demand for
each part and then build inventory between production runs. This, however, creates a host of
inventory control, scheduling and quality problems.
The Mixed Model Assembly line addresses this situation.


  |
|

Upstream Fabrication Demand
These charts, one for each fab operation, show
how batching at assembly creates erratic demand.
|
|


