Implications of the Total Cost Curve
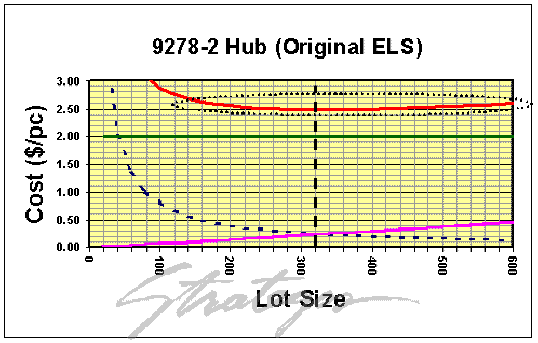
Lot size examples in most textbooks show Total Cost curves that are sharp and narrow. Such
curves indicate a clear optimum. Yet, most real curves are flat and broad as in the figure
below.
There is a theoretical optimum where (dx/dy)=0.00. But, often, on both sides of this optimum,
large changes in lot size bring miniscule changes in cost. This indicates that there is a range
of realistic lot sizes rather than a clear optimum.
The accuracy of the costs used in this analysis is usually questionable. Direct Costs are
often accurate and easily obtained. Setup Costs are more variable but a reasonable estimate can
usually be made. Storage Costs are often buried in overhead accounts. They must be found and
allocated to production units. This makes the Storage Cost component very approximate.

The flatness of the curve and uncertainty of the input costs suggests that the ELS analysis
should be a guide rather than an absolute decision tool. Nevertheless, it is quite a valuable
guide.
Most manufacturers have never done an ELS analysis. They determine batches by instinct,
tradition or guess. Thus, most batches are far too big. Occasionally, they are too small.
|
|
 In
A Nutshell In
A Nutshell
Implications and
conclusions from the ELS analysis. How to use this analysis, along with other factors,
to guide lot sizing.
|
This initial analysis provides a range of lot sizes. Sometimes it is a very wide range. This
raises the question "What other criteria can help select the lot size within the ELS Range?"
Some general guidelines follow.
Lot Size Guidelines
-
Mostly, lot sizes should be at the low end of the ELS range. This reduces capital
requirements, smoothens production and makes scheduling more flexible.
-
When a particular machine is a "bottleneck" and needs to operate at maximum capacity, set
lot sizes at the upper end of the ELS range. This increases inventory buffers before and
after the bottleneck operation but it allows more time for production and less time for
setups.
-
When a piece of equipment must be staffed and maintained even when idle, and if the
equipment is not a bottleneck, set the lot sizes at or below the ELS range. This decreases
inventory but does not increase setup cost.
-
Given the fuzziness of the numbers, set lot sizes to a convenient unit such as "1-day of
production," "two containers" or some round number.
-
Bias your decisions towards the lowest reasonable lot size. The ELS does not capture
intangible costs of larger lots such as quality and scheduling flexibility. In addition,
most accounting systems under-estimate carrying costs.
Practical Lot Size
ELS analysis requires considerable time and effort. With hundreds or thousands of items, an
analysis of each one is impractical. Nor is it necessary. Analyze a few representative parts and
use the results for all similar items. The sample may be just 3-4 parts. 
|


