|

The free newsletter of Lean Manufacturing Strategy
Lean Briefing Archives

Books & Videos

The Strategos Guide To Value Stream and Process Mapping goes far beyond symbols and arrows. In over 163 pages it tells the reader not only how to do it but what to do with it.
More info...
Strategos Guide to Value Stream & Process Mapping
Also...
Guide to Cycle Counting
Facilities & Workplace Design
Warehouse Planning Guide
Human Side of Lean Video


|
 |
Evidence for the Focused Factory
Five Quantitative Studies
|
|
Here we present the results of five
quantitative studies of how focused factory concepts affect operating performance. One might conceivably argue with the conclusions. For example:
-
The studies show correlation, not causality.
Are there other explanations?
-
Why is there so much scatter in the data?
-
Does this really hold for other industries?
These points are valid, to a degree. Manufacturing Strategy, like any strategy is
complex, ephemeral, vague and subject to the whims and chance of nature. It does not lend itself
to the kind of rigorous analysis used for the stress in a wing spar. Nevertheless, this is some
of the best quantitative evidence we have.
|
The Focused Factory is not a "Magic Bullet". It is, rather, one piece
of a Lean Manufacturing Strategy, appropriate for many firms, when combined with other
complementary elements of Lean.
Then, there is the question of implementation. No strategy is effective if the implementation
is ineffective.
Nor can Focused Factories or Manufacturing Strategy compensate for unsound corporate or
marketing strategies.
For example, some years ago we worked with a computer firm that dominated an important market
niche. They developed and executed a highly successful Lean Manufacturing Strategy.
Unfortunately, their new products did not materialize, technologies changed and the
company has disappeared.
|
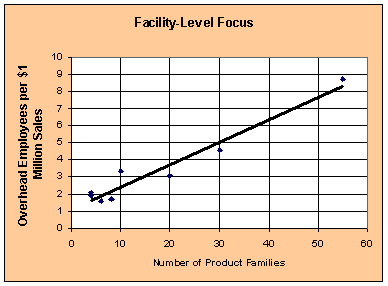
Increasing Focus Reduces Overhead
Circuit Breaker Manufacturing
|
The resources necessary to cope with the complexity of many products, processes or customers
generally involve overhead rather than direct labor and materials.
This chart shows the number of overhead employees at each of eight plants owned by a
manufacturer of circuit breakers. The number of product families ranged from 4-55.
The correlation is clear: the more product families in a plant, the greater the overhead cost
for a given sales volume.
This particular firm had adopted a marketing strategy of offering a complete line of circuit
breakers from smallest to largest. They competed against many smaller firms that offered much
more focused product lines, generally, an untenable position.
This example also illustrates the complex interplay between marketing and manufacturing
strategies.
Adapted from: Stalk, George & Hout, Thomas M., Competing Against Time, The Free Press, New
York, 1990.
|
|
Increasing Focus Increases Operating Margin
Focusing Factories In Multi-Division Companies
|
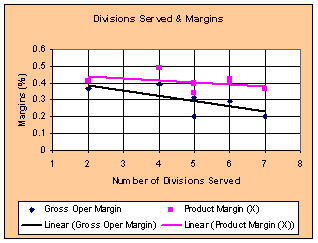 The company illustrated
here had seven regional factories. They had organized into divisions
and each division served a different end-customer group. The plant's product lines, however, did
not correspond to the marketing divisions. Each plant served more than one division. The
divisions were, effectively, the plant's customers. The company illustrated
here had seven regional factories. They had organized into divisions
and each division served a different end-customer group. The plant's product lines, however, did
not correspond to the marketing divisions. Each plant served more than one division. The
divisions were, effectively, the plant's customers.
The charts show operating margin as a function of focus. On the left, focus is gauged by the
number of divisions served. On the right, focus is measured by the number of product lines at a
particular plant.
|
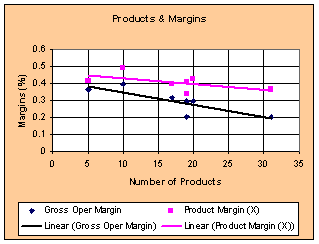 By either measure, increased focus correlates to increased profitability. By either measure, increased focus correlates to increased profitability.
One major product was common to all plants, "Product X". The margins for Product X do not
decline as steeply with decreasing focus as the overall margins, but they still follow the same
pattern.
The conclusion: adding low-volume products to a high volume factory will lower the
high-volume product margins.
Adapted from: Hayes, Robert H., & Wheelwright, Steven C., Restoring Our Competitive Edge,
Wiley, 1984
|
Increased Focus Improves Quality
Focus In A Steel Foundry
|
A steel foundry in this study manufactured wheels for trains. Prior to 1971 the foundry had
two main products which accounted for 99% of their production.
When expansion left the firm with excess capacity, they engineered and sold additional
products to fill the excess capacity. This went on until 1984 when quality and profitability had
declined so much that the firm was in danger. The chart shows casting yield, an indicator of quality, during this period.
The company's accounting system had not reflected the true cost of the new products and they
were under-priced. The company actually lost money on most of this new production.
They decided to re-focus their foundry. The approach was to drastically increase prices on
the new products and reduce prices on the original standard products. This insured a profit on
the new products and increased volume on the original products.
As a result the proportion of production devoted to the original products grew.
|
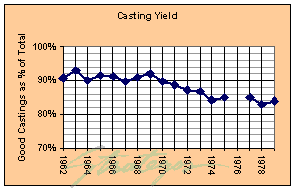 The purple line represents the portion of total production represented by the original two
products. Between 1964 and 1971 this was essentially constant at 98%. As products proliferated,
the proportion represented by the original two lines declined. The purple line represents the portion of total production represented by the original two
products. Between 1964 and 1971 this was essentially constant at 98%. As products proliferated,
the proportion represented by the original two lines declined.
The black line represents labor productivity in man-hours per ton of good casting. From 1964
until 1972, shortly after the new products started coming on-stream, man-hr./ton declined as
productivity increased.
With increased variety, man-hours/ton increased starting in 1973 until 1981. This trend did
not reverse until 1981.
Adapted from: Stalk, George & Hout, Thomas M., Competing Against Time, The Free Press, New
York, 1990.
|
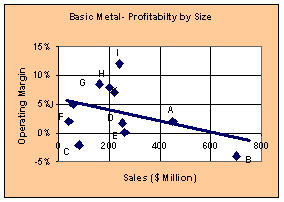
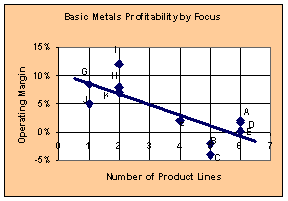
Increased Size & Product Line Lowers Margins
Profitability In Basic Metals
|
In the study results below, eight companies that produce a certain basic metal were studied
by the Boston Consulting Group. Their operating margin was compared to their size (as measured
in sales) and focus (as measured by the number of product lines).
This chart indicates that the number of product lines has a more direct influence. The slope of
the linear regression line is slightly steeper than the line for size and there is less scatter
in the data.
Adapted from: Hayes, Robert H., & Wheelwright, Steven C.,
Restoring Our Competitive Edge, Wiley, 1984
|
  |
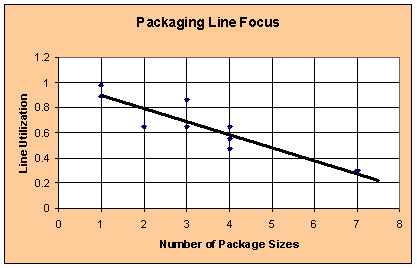
The Effects of Focus on Lines & Workcells
How Focus Principles Apply Within Factories
|
At lower levels of focus such as workcells or lines, increased focus generally brings greater
utilization. The chart above shows this. It comes from a study of similar packaging lines in
various German companies. As the number of package sizes increase from 1 to 7, utilization drops
from 90% to 30%.
This effect is counter-intuitive. One might imagine that if all lines could produce all
products, the variability in customer demand for each product would be better accommodated and
overall utilization increased.
However, the intangible problems of changeovers, learning curves and broader process
knowledge required by all workers counteracts the effects of spreading the variability.
This study supplements the experience and literature of Cellular Manufacturing. Focus at this
level simplifies the process and allows workers and mangers to apply their skills to a narrower
set of problems.
Adapted from: Hayes, Robert H., & Wheelwright, Steven C., Restoring
Our Competitive Edge, Wiley, 1984
|
 |
|
|