How Many Counts Will You Need?
The only sure way to know is to start counting and observe the results. There are too many
variables, too little reliable data and too much effect from selection strategies to accurately
predict the required counts per day. It also depends on resources and how fast you want results.
 Figure 17 contains a wealth of information from very simple data. Every Inventory
Accuracy program should have something similar to monitor progress and identify problems early.
However, the data for such a chart is only available after the program is operating. Figure 17 contains a wealth of information from very simple data. Every Inventory
Accuracy program should have something similar to monitor progress and identify problems early.
However, the data for such a chart is only available after the program is operating.
In
spite of the difficulties and inaccuracies, we still need some sort of advance estimate to
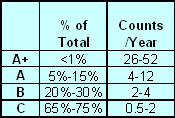
design the program and procure resources. One method is to segregate items into the usual ABC
classes and guess at the annual count frequency for each class. The table shows typical ranges.
Another approach is to simulate the system with a simple spreadsheet based on statistical
theory. Our Cycle Count Estimator uses both approaches.
Strategos Cycle Count Estimator
Our Cycle Count Estimator
takes the form of an Excel worksheet. It starts with simple information from past physical
inventories and displays Inventory Record Accuracy for given cycle count frequencies for
two-years. Up to five scenarios on each display allow comparison of different cycle count rates,
Error Creation Rates or count selection strategies. Since it does not account for targeting
strategies such as zero-balance counts, actual results are likely to be better than predicted.

Figure 16 Data Inputs for Cycle Count Estimator

|


