Introduction
Backplotting is the process of taking an RS274 file and drawing the moves that will be made by the machine tool when it runs the file. Tk backplot does that by drawing a set of lines on Tk canvas widgets. TkBackplot runs a full version of EMC and plots changes in the position variables while the program is running. Only axis motion is plotted. The current version does not do anything with tool changes or tool radius compensation.
By plotting the actual change in tool position, TkBackplot will give you a very accurate impression of how the real tool will move on a real machine.
(The reader should note that with the newer releases of the EMC, tkbackplot can be started from the menus of the tkemc graphical user interface. You will find it under the view menu.)Version Listing
Specifications
Features of TkBackplot
Feedrate override to 200%
Four simultaneous plots
Clear plot and restart from any line
Highlight last line executed and shift line after estop and abort
Reverse the plotted direction of each axis to set like your machine
Works with positive and negative axis directions
Apply axis offsets and plot machine-relative-commanded-actual
position
Apply size multiplier for small or big parts
Uses genedit.tcl for file, tool, and variable editing. Popup
Download here: Bkplot1.tgz
How it works
Uses a full running version of emc under Linux2_0_36
EMC commands issued by a menu driven gui using mouse commands
Computes a move based on each update of the emc position digits
Computes size and offset to digit change
Draws lines on four tk canvas widgets xy xz yz 3d
Limitations
No zoom feature
Less resolution at higher speeds and for rapid moves (200%)
Offsets, size, axis direction, and canvas size, and 3d angles
are not saved in this version
They can be changed in emc/Backplot to come up the way you want.
Canvas size is in pixels rather than inches or mm.
Generates step and direction signals to the second printer port
2.
Must disconnect any devices on second parport
Will not run while other emc's are running on the same processor.
No help file. Only this.
Setup
The release is contained in one tar file - bkplot.tgz. It contains several files that are compressed from the December 1999 2_0_36 EMC build. For my system the files and the directories they untar into are:
Backplot
backplot.ini
backplot.run
plat/linux_2_0_36/bin/tkbackplot
These files will be placed in the correct directories for that build if you untar the file in the startup directory that you run emc from. backplot.run requires the other backplot files and uses the equivalent of the emc minimill system with several squirreled up ini variables. (If you are running the 2.2.10 build you will have to move tkbackplot to that directory and delete the 2.0.36 directory created by tar.
Customizing
If you have a working version of EMC installed, TkBackplot should be ready to run right out of tar. The only problems that others have encountered are the settings of the shared memory location and the memory size in your computer. You should be able to enter ./backplot.run from your emc directory. This run file calls backplot.ini which is setup just for the backplotter. Your TkEmc appearance file has no effect on the display. It's set for a low res screen (640x480) but you can run it in a corner of a bigger display or reduce display size. Once you have familiarized yourself with TkBackplot you can edit the file named Backplot in your emc directory to change location of the home position and the size of each of the canvas widgets to match the way these things are for your own machine. This file has full comments to help you make those changes. But for the first few runs, just work it the way it comes up.
If you are set up with a second parallel port, you should disconnect whatever is connected to it. because this version of TkBackplot spits out all the stepper signals and looks for limit and home switches.
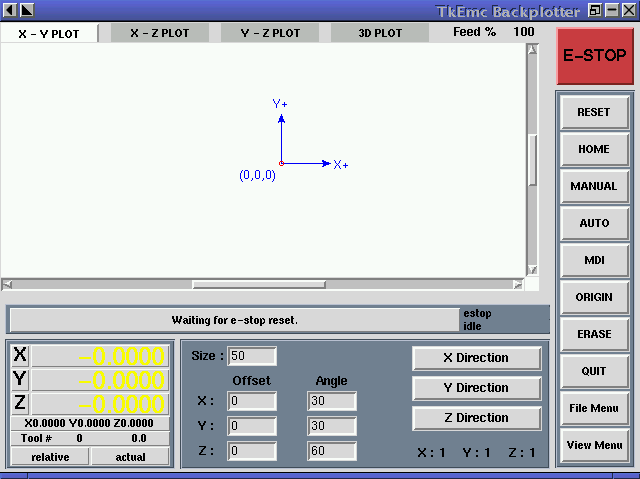
The image below shows the startup screen of TkBackplot. The largest share is dedicated to the canvas widgets that do the plotting. You can select any of the four plots by left clicking on the top label of the plot that you wish to view.

Just below the plot area is a light gray message board. In the visual above, the message board says, "Waiting for e-stop reset." This board provides some advice as you get ready to run, and as you press the wrong buttons during operation. To the right of this board are two displays. The top one shows the real condition of the virtual machine, estop, reset, and machine on. If you've worked with EMC for a while you know that occasionally it is stubborn about startup. If you are not able to get it out of estop, press quit and run it again. If it still refuses to go, check the ini file for differences between your computer and mine.
Below the machine condition display is a display that shows the state of the interpreter. idle, running, or paused.
The button labeled <reset> is your key to getting it going. The first press of it should change machine mode to reset, the second press should get you to machine on. A third press should execute an emc_task_plan_init that resets most of the auto and mdi modal codes.
Once you have the machine running, press <home> and the virtual axes will run off to a home position. You will know that the axis are home when the large position lettering on the bottom right side of the screen turns green. Left clicking on the numbers or the axis name will focus that axis for manual moves. Left clicking on the relative and actual buttons will change the coordinate system that is displayed and used during plotting.

The center bottom area will show many different widgets depending on where you are. The opening widget as shown in the first visual above lets you set axis direction, offset, and size. <manual>, <auto>, and <mdi> will change this display as will several of the file buttons. The display immediately above is for auto mode. It shows file name, current line number, and for longer program, it will highlight the currently executing line. The program shown is an incrementing program that uses an endmill to clean up one edge of metal.
Startup
When backplot starts up 0,0 will be near the center of display
at the intersection of the two blue lines shown. I'd start out
plotting by using the the mdi mode and the stock plot settings.
Just press <mdi> after you have it homed out and the
mdi widget will show. Enter f5 x2 y1 z0.5 or some such three axis
move and <return> will start the plot of the move. You can
switch between plots to see all four views while the virtual move
is being made.
You should get a diagonal line 100 pixels right on x and 50 pixels up on y and when you view the z plot you should see 25 pixel diagonal line up in z. The <origin> button will always draw the origin and directions at canvas 0,0. It will also shift the view to place the origin near the center of the visible area of the widget.
Tkbackplot version 1.0.1 will color the tool path depending upon the type of move called for.
 If you invert any of the axis the
origin will show the inverted direction. Many machine tools do
not work the same way graph paper does. These direction buttons
allow you to plot your programs just like they will run on your
machine. You can also enter offsets and watch the little red tool
move away from (0,0,0). I use these offsets when I want to plot
an enlarged section of a program to see some detail. Otherwise
I just leave them alone. You can see an example of the use of
enlargement and offsets on the last visual of this page.
When you have created a mess on the screen and you want to start over <erase> cleans everything from the screens and starts the plotting process over. The little red tools should be immediately redrawn and you are ready to work again. Press <origin> if you want to add back in the directional lines. If the tools do not show press <set tool> on the view menu.
Auto Mode
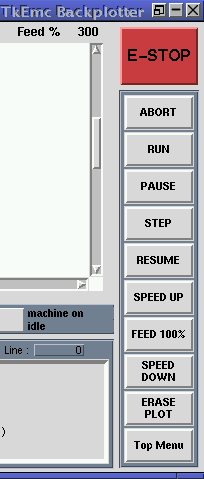
Most of the auto mode buttons shown at the right should be familiar to the EMC user. TkBackplot has been optimized to allow up to 200% feedrate. At the higher speeds you will loose some resolution and your sharp corners will begin to look a bit snaggle-toothed. But the high speed will allow you to run/verify some longer programs in a reasonable length of time.
The speed up button will increase feedrate override by 20 percent each press. If you hold it down it will repeat but you may loose some of your plot if you are running while holding the speed up or down button down. Speed down decreases feedrate by 5% each press or each repeat.
 When you first press <auto>
you will be shown the file selection widget so you can pick the
file that you want to run. This also sets a new bunch of buttons
along the right side of the screen as shown on the left.
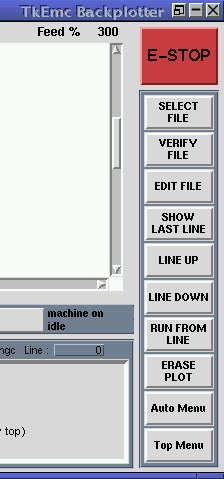
You can access this set of buttons at any time from the top menu. They are called the file menu.
<select file> will always raise the file dialog that will change programs.
<verify file> is the EMC verifyer. Errors show in the message area
<edit file> brings up the standard EMC file editor. (or the enhanced one)
<show last line> shows where the last running program quit, aborted, estopped.
<line up> and <down> shift that line. Holding them down will repeat slowly.
<run from line> starts EMC at the highlighted line.
Manual mode
You should have already tried the mdi entry and yes manual mode will also work. Just select an axis, a jog type, increment and size, or continuous and press the direction you want to go. Like most of the other EMC guis, you can only jog one axis at a time. When you are through with manual operations, and you find the red axis label annoying, press the select axis button until none of the labels is highlighted.
Using Offsets
The offsets for the axis allow you to move the 0,0,0 point for a plot. The default canvas is about 2000 pixels across and 1000 pixels up and down. So at a 100 size you should be able to plot a 10 x 5 inch part and see it all in one quadrant. You can apply any offset that you like. A 950 offset to the horizontal and a 450 to the vertical to the default size will move all of the canvas into a single quadrant.
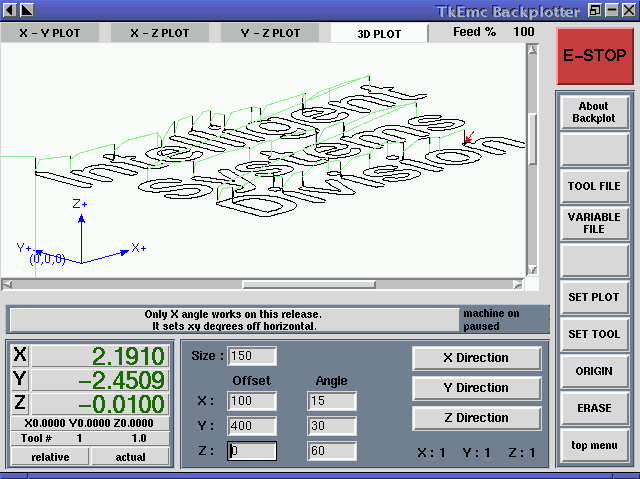
The bkplot2.gif file below shows the backplotter screen after running most of isd.ngc. This shows the plot of that file using the new 3d capability. I've been curious about this part program file for a long time. Now I know what it does. And now, so do you.

Good luck. Let me know what bugs you find or changes you think would make backplot a more productive verification tool for you.
One of my kids watched the red arrows moving around for a minute and asked, "But who buys virtual parts?" The only reply I could think of is that shipping them is cheap.
Ray Henry <rehenry@up.net
358 Swante Aho Road
Crystal Falls, MI 49920 USA